RH (NYSE: RH) · Q2 FY2026 · EARNINGS ANALYSIS
RH: The refund is real. The recovery still has to arrive.
Q2 FY2026 | Revenue rose 2.6%, but EBITDA excluding the tariff refund fell 33.3%. A bigger fourth-quarter bet now carries the year.
RH beat the quarterly revenue and margin guidance it gave in June. That deserves credit. It does not establish a recovery in underlying earnings. Revenue reached $922.2 million, while GAAP operating income fell 16.5%. Net income nevertheless rose 16.4% to $60.2 million, helped by tariff refunds and a swing to income from equity-method investments. The most useful operating comparison is RH's own normalized adjusted EBITDA: $123.5 million, down 33.3% from $185.1 million. [1, financial tables T-1 and T-12]
Three things matter for investors: the earnings benefit from refunds, the composition of cash generation, and whether the backlog and RH Estates turn into delivered revenue in the fourth quarter. Management has supplied dates and numerical targets. Those are now the tests.
Delta Sheet
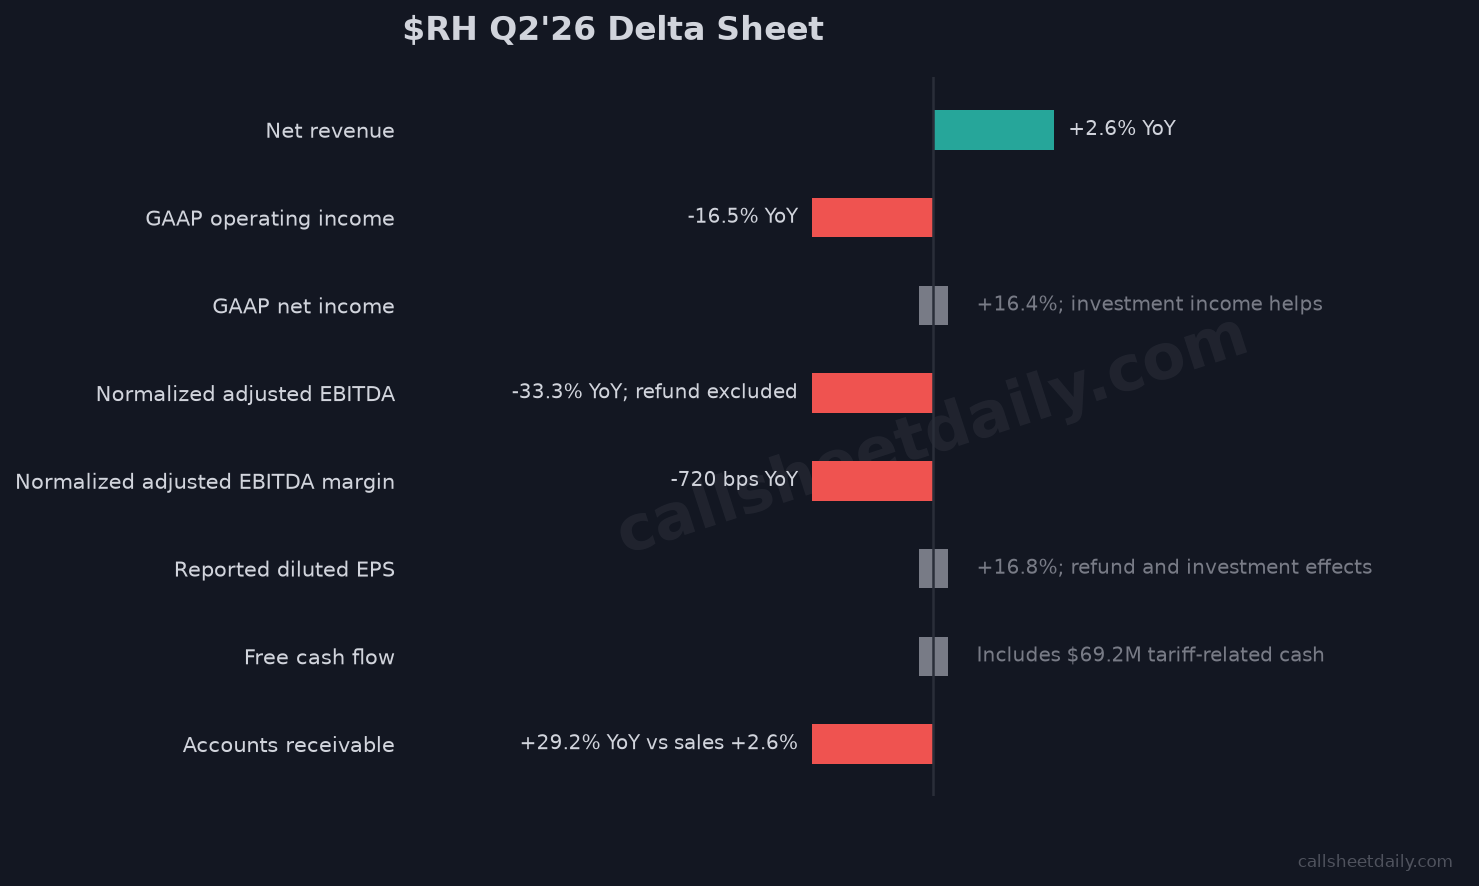
- Net revenue: Prior comparison: $899.151M, Q2 FY2025; Q2 FY2026 / latest outlook: $922.150M; What changed: +2.6% YoY
- GAAP operating income: Prior comparison: $128.876M; Q2 FY2026 / latest outlook: $107.573M; What changed: -16.5% YoY
- GAAP net income: Prior comparison: $51.708M; Q2 FY2026 / latest outlook: $60.167M; What changed: +16.4%; investment income supports the result
- GAAP diluted EPS: Prior comparison: $2.62; Q2 FY2026 / latest outlook: $3.06; What changed: +16.8%; includes refund and investment effects
- Adjusted diluted EPS: Prior comparison: $2.93; Q2 FY2026 / latest outlook: $2.70; What changed: -7.8%; still includes tariff benefits
- Normalized adjusted EBITDA: Prior comparison: $185.121M; Q2 FY2026 / latest outlook: $123.460M; What changed: -33.3%, excluding the current refund benefit
- Normalized adjusted EBITDA margin: Prior comparison: 20.6%; Q2 FY2026 / latest outlook: 13.4%; What changed: -720 basis points on reported rounded margins
- Quarterly free cash flow: Prior comparison: $80.678M; Q2 FY2026 / latest outlook: $99.578M; What changed: +23.4%; includes $69.2M tariff-related cash
- Free cash flow less tariff-related cash: Prior comparison: $80.678M prior reported FCF; Q2 FY2026 / latest outlook: Approximately $30.4M; What changed: -62.3%; analytical sensitivity
- Accounts receivable: Prior comparison: $61.248M, Aug. 2, 2025; Q2 FY2026 / latest outlook: $79.130M, Aug. 1, 2026; What changed: +29.2% YoY versus sales +2.6%
- Merchandise inventory: Prior comparison: $956.947M, Aug. 2, 2025; Q2 FY2026 / latest outlook: $772.716M; What changed: -19.3% YoY; includes $13.9M refund-related reduction
- FY2026 revenue growth guide: Prior comparison: 4.5%–8.0%, June; Q2 FY2026 / latest outlook: 5.5%–7.0%, September; What changed: Narrowed; midpoint remains 6.25%
- FY2026 international margin drag: Prior comparison: 270 bps, June outlook; Q2 FY2026 / latest outlook: 340 bps; What changed: 70 bps worse; estimate revised before year-end
Sources: current shareholder letter and 10-Q, prior-year 10-Q, and June shareholder letter. Quarterly results are year-over-year; guidance comparisons are June versus September. The free-cash-flow sensitivity removes cash receipts, not an assumed earnings tax charge. [1; 2; 3; 4]
Inside the full report
New Disclosures & Changes, Narrative Regressions, Binders vs Narrative, Promise Ledger, New Promises, Disclosure Quality Score, Financial Quality Indicators, AI Commentary, What to Verify, management questions and Bottom Line — including the refund-to-EPS sensitivity, cash-flow bridge and backlog commitments.
Read the full RH analysis →