ORACLE (NYSE: ORCL) · Q1 FY2027 · EARNINGS ANALYSIS
Oracle: Customers are financing the AI buildout. Free cash flow is still negative.
Q1 FY2027 | Revenue rose 30%. Nearly half of operating cash flow came from customer prepayments with a financing component.
Oracle delivered real growth: $19.345 billion of revenue, $6.728 billion of GAAP operating income and $4.679 billion of net income available to common shareholders. Those rose approximately 30%, 57% and 60%, respectively. Cloud infrastructure revenue more than doubled. The immediate question is how much cash the expansion requires and who supplies it. [1]
The cash-flow statement provides the answer that the headline does not: $11.363 billion of customer prepayments with a significant financing component contributed to $23.103 billion of operating cash flow. Even with that funding, cash capex of $28.499 billion left free cash flow negative $5.396 billion. These are disclosed transactions, not evidence of improper revenue recognition. They do mean that reported operating cash flow is not equivalent to cash earned solely from services already delivered. [1, cash-flow and capex reconciliations]
Delta Sheet
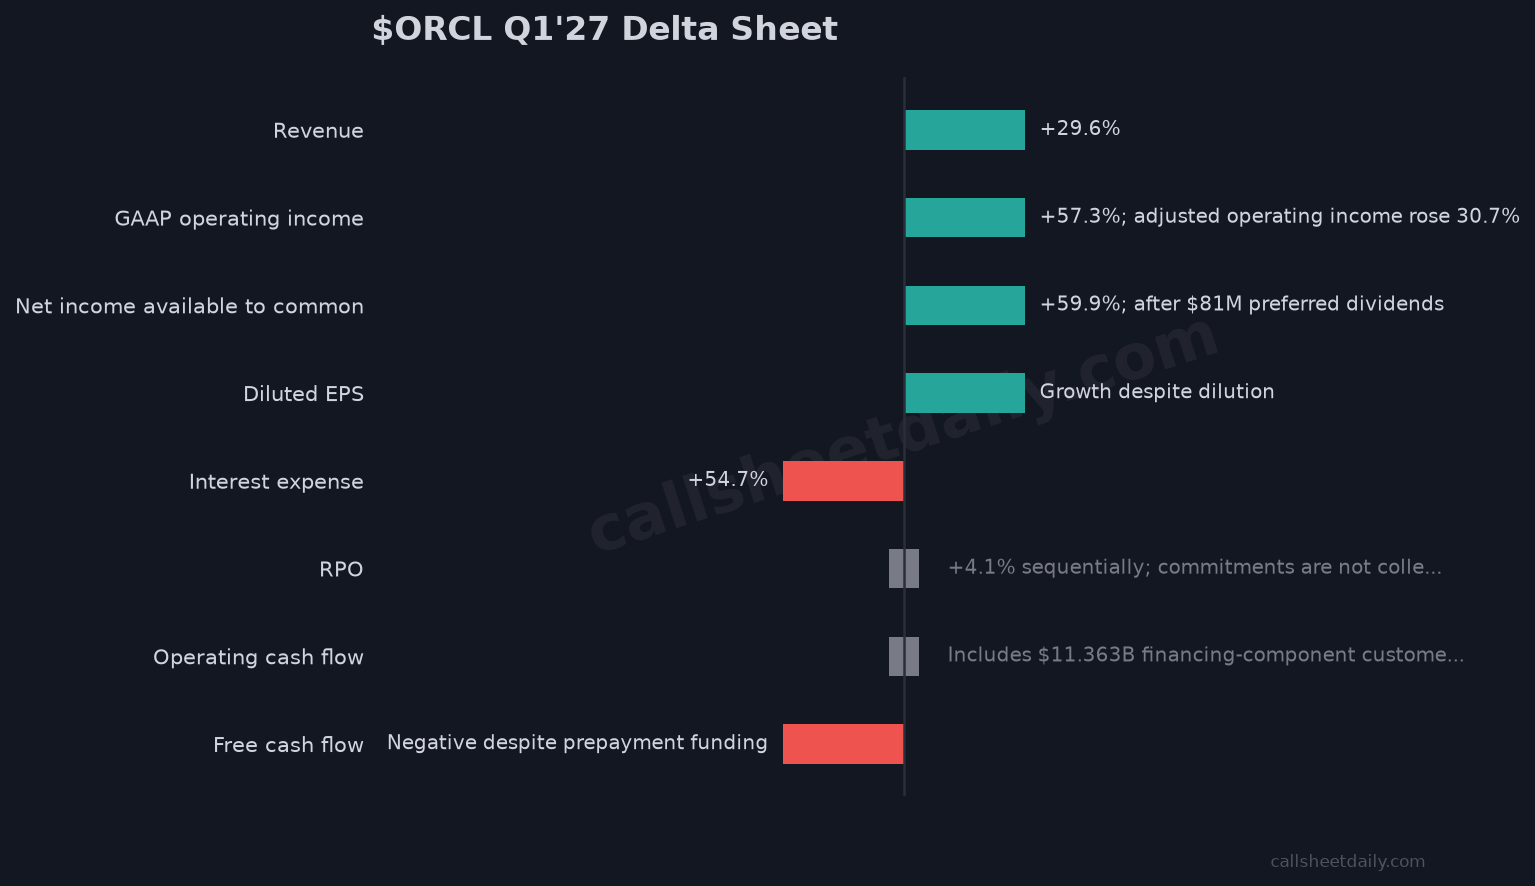
- Revenue: Prior comparison: $14.926B, prior-year quarter; Q1 FY2027: $19.345B; Investor test: +29.6%
- GAAP operating income: Prior comparison: $4.277B; Q1 FY2027: $6.728B; Investor test: +57.3%; adjusted operating income rose 30.7%
- Net income available to common: Prior comparison: $2.927B; Q1 FY2027: $4.679B; Investor test: +59.9%; after $81M preferred dividends
- Diluted EPS: Prior comparison: $1.01 GAAP / $1.47 adjusted; Q1 FY2027: $1.56 / $1.92; Investor test: Growth despite dilution
- Diluted weighted-average shares: Prior comparison: 2.909B; Q1 FY2027: 3.000B; Investor test: +3.1%
- Interest expense: Prior comparison: $923M; Q1 FY2027: $1.428B; Investor test: +54.7%
- RPO: Prior comparison: $638B, May 2026; Q1 FY2027: $664B; Investor test: +4.1% sequentially; commitments are not collected earnings
- Operating cash flow: Prior comparison: Current-quarter composition; Q1 FY2027: $23.103B; Investor test: Includes $11.363B financing-component customer prepayments
- Free cash flow: Prior comparison: Cash capex $28.499B; Q1 FY2027: -$5.396B; Investor test: Negative despite prepayment funding
- FY2027 adjusted EPS guide: Prior comparison: $8.05, June; Q1 FY2027: $8.10; Investor test: Raised by $0.05
Financial comparisons are year-over-year except the explicitly identified May RPO and June guidance comparisons. Figures use the company's reconciliations. [1; 2]
Inside the full report
New Disclosures & Changes, Narrative Regressions, Binders vs Narrative, Promise Ledger, New Promises, Disclosure Quality Score, Financial Quality Indicators, AI Commentary, What to Verify, management questions and Bottom Line — including customer-funding terms, the capex and cash-flow reconciliation, RPO, and management commitments.
Read the full ORCL analysis →