LOVESAC · Q2 FY2027 · INITIAL FINANCIAL REVIEW
Lovesac: A profitable headline, a loss without the refund.
Q2 FY2027 | Initial financial review · Results released September 10, 2026
Lovesac's reported $0.51 EPS includes a company-disclosed $0.86 net benefit from tariff refunds. The simple refund-excluded comparison is therefore approximately a $0.35 loss per share. Same-channel sales and refund-excluded margins show why the distinction matters. [1]
Delta Sheet
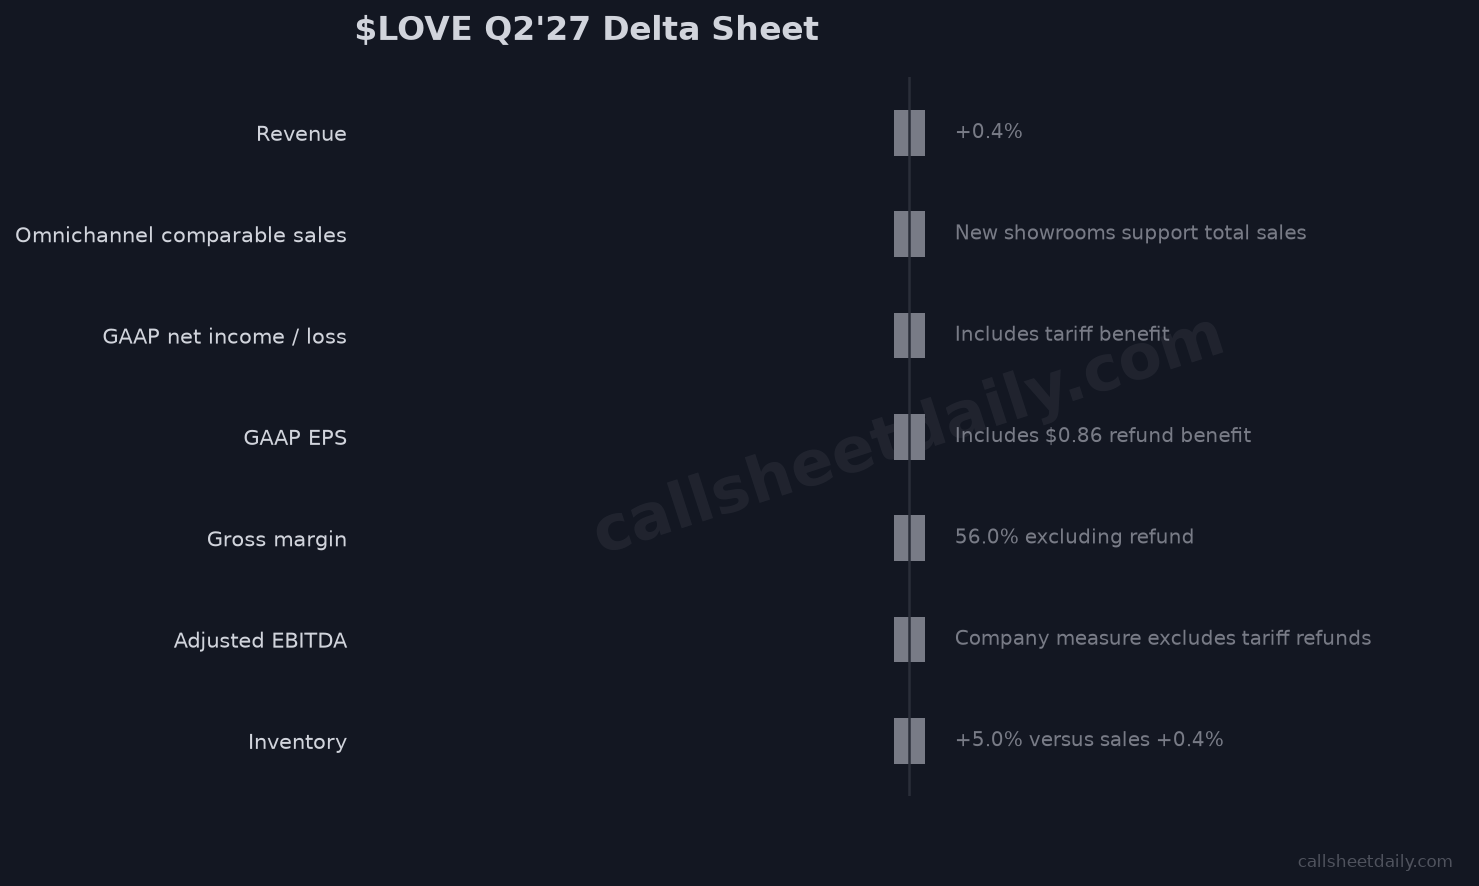
- Revenue: Prior / basis: $160.5M; Current: $161.2M; Change or interpretation: +0.4%
- Omnichannel comparable sales: Prior / basis: Prior-year comparison; Current: -1.9%; Change or interpretation: New showrooms support total sales
- GAAP net income / loss: Prior / basis: -$6.7M; Current: +$7.4M; Change or interpretation: Includes tariff benefit
- GAAP EPS: Prior / basis: -$0.45; Current: +$0.51; Change or interpretation: Includes $0.86 refund benefit
- Gross margin: Prior / basis: 56.4%; Current: 68.4%; Change or interpretation: 56.0% excluding refund
- Adjusted EBITDA: Prior / basis: +$0.8M; Current: -$1.3M; Change or interpretation: Company measure excludes tariff refunds
- Inventory: Prior / basis: $124.0M; Current: $130.2M; Change or interpretation: +5.0% versus sales +0.4%
Comparisons are year-over-year unless expressly labeled otherwise. [1]
Inside the full report
New Disclosures & Changes, Narrative Regressions, Binders vs Narrative, Promise Ledger, New Promises, Disclosure Quality Score, Financial Quality Indicators, AI Commentary, What to Verify, management questions and Bottom Line — including the refund-to-EPS sensitivity, underlying margins, inventory and management commitments.
Read the full LOVE analysis →