NATIONAL BEVERAGE (NASDAQ: FIZZ) · Q1 FY2027 · FILINGS ANALYSIS
FIZZ: Falling Volume, Rising Costs, and a Shrinking Hedge Cushion
National Beverage's first-quarter filing shows what flat sales leave out: 6.4% fewer cases, a 17.4% decline in operating profit, and a smaller balance of hedge gains awaiting recognition.
Call Sheet Daily | September 11, 2026 | Fiscal Q1 2027 ended August 1, 2026
National Beverage reported on September 10. Its sales were almost unchanged. The business underneath those sales was not.
The 10-Q says average selling price per case increased 7.1%, while case volume declined 6.4%. Cost of sales per case increased 12.4%. Operating income fell 17.4% to $58.5 million. Selling more dollars per case could not offset the combination of fewer cases and faster cost inflation. [1, pp. 4, 14]
The less obvious finding is in the derivatives footnote. Aluminum hedge gains reduced this quarter's cost of sales by $6.578 million. Yet the existing unrealized gains expected to reach earnings over the following twelve months fell from $16.0 million at fiscal year-end to $2.3 million at August 1, assuming unchanged commodity prices. That is a much smaller disclosed cushion behind management's recovery narrative. [1, p. 12; 2, PDF p. 29]
Hedging contributed 5.37 cents to diluted EPS this quarter, versus 4.16 cents a year earlier. The current after-tax benefit was $5.026 million, or 10.7% of reported net income. Mechanically excluding that benefit leaves approximately $0.45 per diluted share, compared with reported EPS of $0.50. This sensitivity isolates the accounting contribution of hedge gains; it does not reconstruct what the business would have earned without hedging. [1, pp. 4, 12]
These are material operating and earnings-quality concerns. The documents reviewed do not establish fraudulent accounting or channel stuffing. The evidence supports a demanding critique without those accusations.
Delta Sheet
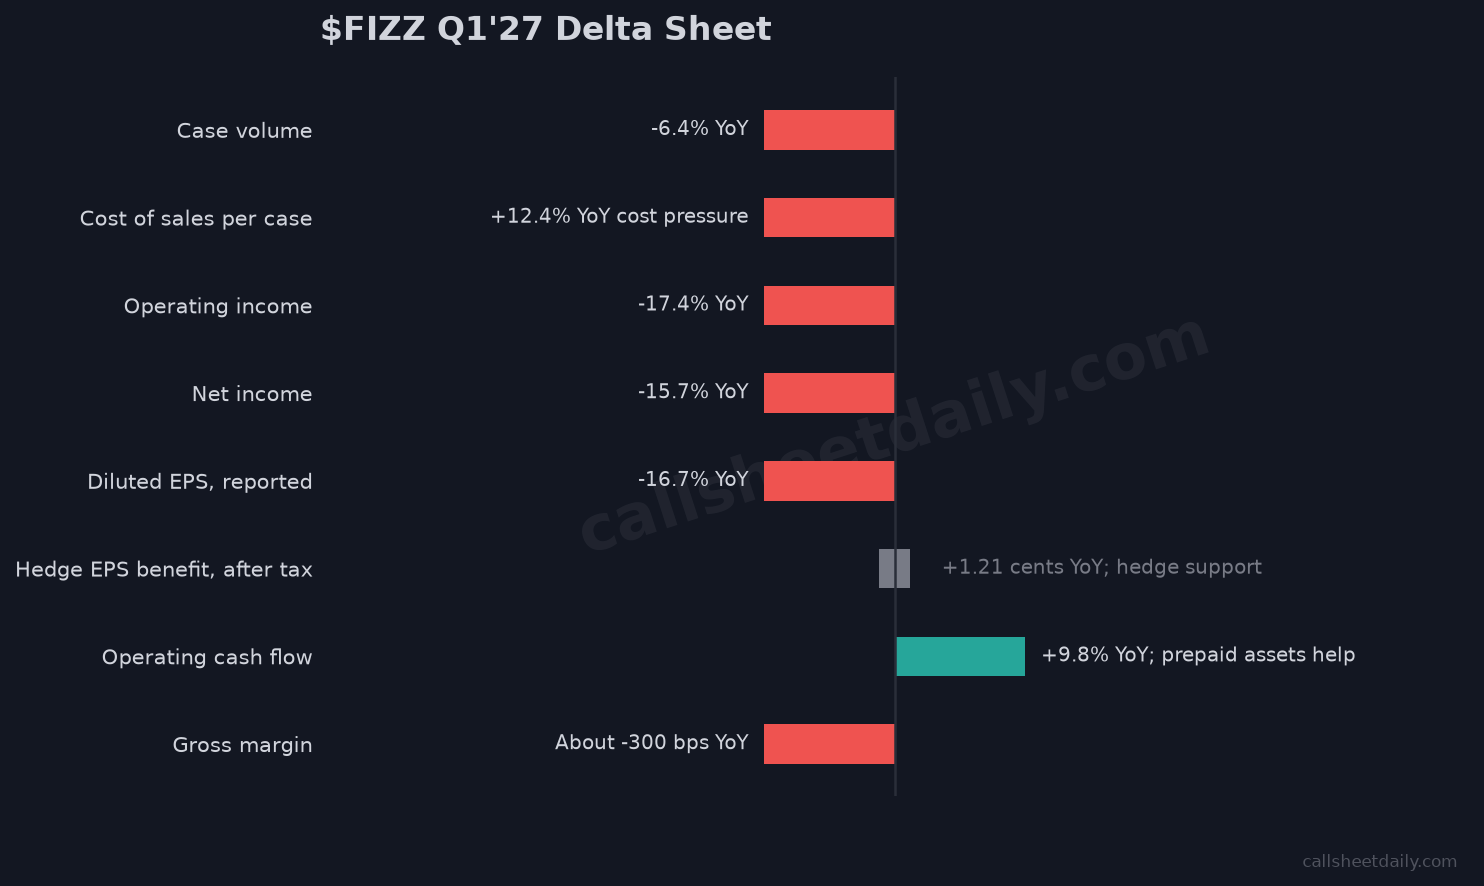
| Measure | Q1 FY2026 | Q1 FY2027 | Change |
|---|---|---|---|
| Net sales | $330.515M | $330.662M | +0.04% |
| Gross profit | $125.463M | $115.790M | -7.7% |
| Gross margin | 38.0% | 35.0% | About -300 bp |
| Selling, general and administrative expense | $54.687M | $57.310M | +4.8% |
| Operating income | $70.776M | $58.480M | -17.4% |
| Operating margin, calculated | 21.41% | 17.69% | -373 bp |
| Net income | $55.760M | $47.004M | -15.7% |
| Diluted EPS, reported | $0.60 | $0.50 | -16.7% |
| Hedge contribution to diluted EPS, after tax | 4.16 cents | 5.37 cents | +1.21 cents |
| Operating cash flow | $59.089M | $64.850M | +9.8% |
| Cash capital expenditure | $3.095M | $3.071M | -0.8% |
| Free cash flow, calculated | $55.994M | $61.779M | +10.3% |
Source: 10-Q income and cash-flow statements. Both are first-quarter periods. Free cash flow is operating cash flow less cash purchases of property, plant and equipment; it is our calculation, not a separate GAAP line. Margin changes use unrounded statement amounts except the explicitly rounded gross-margin comparison. [1, pp. 4, 7, 14]
The release is sparse, but it does not conceal every adverse fact. It discloses a 35% gross margin, lower margins, the $107 million cash balance after the dividend, and an aluminum-cost impact approaching 600 basis points. What it omits are the precise price/volume split, the 12.4% cost-per-case increase, operating profit, the cash-flow bridge and the hedge detail. Its financial table contains sales, net income, EPS and share counts. [3]
That distinction matters: the charge is incomplete financial explanation, not that management disclosed nothing unfavorable.
Inside the full report
New Disclosures & Changes, Narrative Regressions, Binders vs Narrative, Promise Ledger, New Promises, Disclosure Quality Score, Financial Quality Indicators, AI Commentary, What to Verify, management questions and Bottom Line - including the full hedge-to-EPS calculation.
Read the full FIZZ analysis →